
Load Curve of a Power Station
Load Curve of a Power Station
- The Curve showing the variation of load on the Power Station with reference time is known as a Load Curve.
- The Load Curve is a Graph, which represents load on the generation station (the load is in kW/MW) recorded at the interval of half hour or hour (time) against the time in chronological order.
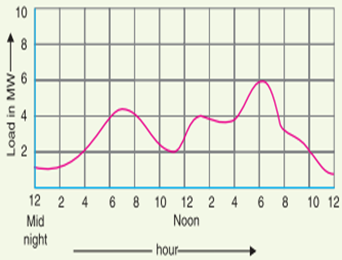
- We have to draw the load curve on daily basis data, weekly, monthly basis data. The curves showing the variation of load on the power station with respect to time is known as load Curves.
- The area under the daily load curve gives the number of unit generated in the day.
Unit generated/day= Area (in kWh) under daily load curve.
- The highest point on the daily load curve represents the maximum demand on the station on that day.
- The area under the load curve divided by the total number of hours gives the average load on the station.
Average Load = Area (in kWh) under daily load curve/24 hours


Recent Comments