
Speed-Time Curve of Main Line Service
A speed time-curve is a graph showing the variation of speed with respect to time. The curve drawn between speed and time, taking speed on the Y axis and time on X-axis, is known as speed-time curve. The speed-time curve provides complete information of the motion of the train.
The distance between two stops in main line service is considerably more (usually more than 10 km). In this service free run is of longer duration. The duration of acceleration and retardation is a small fraction of total running time.
Speed-time curve mainly consists of,
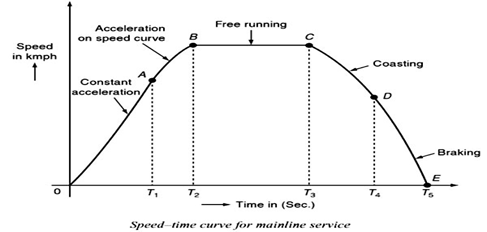
1. Constant Acceleration or Acceleration during Notching Up or Rheostatic acceleration: During notching up period (0 to A) the current is maintained approximately constant and the voltage across the motor is gradually increased by cutting out the starting resistance. Thus tractive effort is constant and, therefore, acceleration remains constant during this period.
2. Speed Curve Running or Acceleration on Speed Curve: During speed curve running (A to B) the voltage acting across the motor remains constant and current starts decreasing with the increase in speed according to the characteristics of the motor and finally the current taken by the motor becomes constant. During this period, though the train accelerates but acceleration decreases with the increase in speed and finally becomes zero at the speed at which the tractive effort developed by the motor becomes exactly equal to the resistance to motion of the train.
3.Free Run or Constant Speed Run(B to C): At the end of speed curve running i.e., at B the train attains the maximum speed. During this period the train runs with constant speed attained at and constant power is drawn.
4. Coasting(C to D): At the end of free running period (i.e., at C) power supply is cut off and the train is allowed to run under its own momentum. The speed of train starts decreasing on account of resistance to the motion of train. The rate of decrease of speed during coasting period is known as coasting retardation.
5.Retardation or Braking Period(D to E): At the end of coasting period (i.e., at D) the brakes are applied to bring the train to rest. During this period speed decreases rapidly and finally reduces to zero.
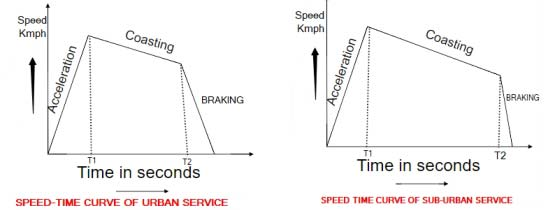
Speed time curve of Urban & Sub urban service
Urban Service: In urban or city service the distance between the two stops is comparatively very short (say 1 km or so). The time required for this run is very small (few minutes). The acceleration as well as retardation is required to be high so that high average speed and short time of run is obtain.


Recent Comments